Flume之監控
來源:程序員人生 發布時間:2016-06-03 07:59:26 閱讀次數:15425次
Flume作為1個日志搜集工具,在數據收集方面,展現出了非常強大的能力。它的SOURCE、SINK、CHANNEL3大組件這類模式,來完成數據的接收、傳輸、發送這個進程,具有非常完善的契合度。不過這里,我們要說的不是Flume有多好或Flume有哪些優點,我們要談的是Flume的監控。
1、為何需要Flume監控?
Flume作為1個強大的數據搜集工具,雖然功能非常強大實用,但是當需要看到flume搜集的數據信息的時候卻沒有1個界面能夠展現出來,所以我們需要1個能展現flume實時搜集數據動態信息的界面,包括flume成功搜集的日志數量、成功發送的日志數量、flume啟動時間、停止時間、和flume1些具體的配置信息,像通道容量等,因而順利成章的監控能幫我們做到這些,有了這些數據,在遇到數據搜集瓶頸或數據丟失的時候,通過分析監控數據來分析、解決問題。
2、Flume有哪些監控方式?
(1)、Http監控
使用這類監控方式,只需要在啟動flume的時候在啟動參數上面加上監控配置,例如這樣:
bin/flume-ng agent --conf conf --conf-file conf/flume_conf.properties --name collect -Dflume.monitoring.type=http -Dflume.monitoring.port=1234
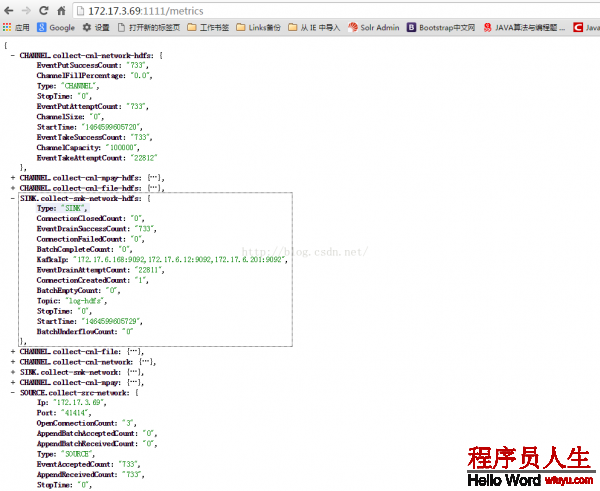
其中-Dflume.monitoring.type=http表示使用http方式來監控,后面的-Dflume.monitoring.port=1234表示我們需要啟動的監控服務的端口號為1234,這個端口號可以自己隨便配置。然后啟動flume以后,通過http://ip:1234/metrics就能夠得到flume的1個json格式的監控數據。
(2)、ganglia監控
這類監控方式需要先安裝ganglia然后啟動ganglia,然后再啟動flume的時候加上監控配置,例如:
bin/flume-ng agent --conf conf --conf-file conf/producer.properties --name collect -Dflume.monitoring.type=ganglia -Dflume.monitoring.hosts=ip:port
其中-Dflume.monitoring.type=ganglia表示使用ganglia的方式來監控,而-Dflume.monitoring.hosts=ip:port表示ganglia安裝的ip和啟動的端口號。
flume監控還可使用zabbix,但是這類方式需要在flume源碼中添加監控模塊,相對照較麻煩,由于不是flume自帶的監控方式,這里不討論這類方式。
因此,flume自帶的監控方式其實就是http、ganglia兩種,http監控只能通過1個http地址訪問得到1個json格式的監控數據,而ganglia監控是拿到這個數據后用界面的方式展現出來了,相對照較直觀。
3、Flume監控哪些組件、能夠得到組件的哪些信息?
(1)、SOURCE
SOURCE作為flume的數據源組件,所有搜集日志的第1個到達的地方,它的監控信息非常重要。通過監控我們能夠得到的監控數據有這些:
OpenConnectionCount(打開的連接數)、Type(組件類型)、AppendBatchAcceptedCount(追加到channel中的批數量)、AppendBatchReceivedCount(source端剛剛追加的批數量)、EventAcceptedCount(成功放入channel的event數量)、AppendReceivedCount(source追加目前收到的數量)、StartTime(組件開始時間)、StopTime(組件停止時間)、EventReceivedCount(source端成功收到的event數量)、AppendAcceptedCount(放入channel的event數量)等。固然這些只是flume監控源碼中已自帶的監控元素,如果你需要其他的監控信息,例如ip、端口號等,有兩種方法,第1個,修改監控源碼,添加你需要的監控元素,這類方法只是在原有代碼基礎上,添加1些滿足自己需求的監控元素,比較簡單,但靈活性不足;第2個就是自定義監控組件,這類方法是在原有監控框架中,自己實現自己的監控組件,這樣可以到達完全滿足自己需求,且靈活性很高。至于這兩種方法如何操作,在后面Flume監控如何實現有討論到。
同理CHANNEL、SINK這兩個組件的監控也能夠使用這兩種方法來添加自己想要的監控元素。
(2)、CHANNEL
CHANNEL是flume的1個通道組件,對數據有1個緩存的作用。能夠得到的數據:
EventPutSuccessCount(成功放入channel的event數量)、ChannelFillPercentage(通道使用比例)、Type(組件類型)、EventPutAttemptCount(嘗試放入將event放入channel的次數)、ChannelSize(目前在channel中的event數量)、StartTime(組件開始時間)、StopTime(組件停止時間)、EventTakeSuccessCount(從channel中成功取走的event數量)、ChannelCapacity(通道容量)、EventTakeAttemptCount(嘗試從channel中取走event的次數)等。
(3)、SINK
SINK是數據行將離開flume的最后1個組件,它從channel中取走數據,然后發送到緩存系統或持久化
數據庫。能得到數據:
BatchCompleteCount(完成的批數量)、ConnectionFailedCount(連接失敗數)、EventDrainAttemptCount(嘗試提交的event數量)、ConnectionCreatedCount(創建連接數)、Type(組件類型)、BatchEmptyCount(批量取空的數量)、ConnectionClosedCount(關閉連接數量)、EventDrainSuccessCount(成功發送event的數量)、StartTime(組件開始時間)、StopTime(組件停止時間)、BatchUnderflowCount(正處于批量處理的batch數)等。
4、Flume監控是如何實現的?
首先在flume-ng-node中org.apache.flume.node.Application的main方法中,有1個startAllComponents()方法:
private void startAllComponents(
MaterializedConfiguration materializedConfiguration) {
logger.info("Starting new configuration:{}", materializedConfiguration);
this.materializedConfiguration = materializedConfiguration;
for (Entry<String, Channel> entry : materializedConfiguration
.getChannels().entrySet()) {
try {
logger.info("Starting Channel " + entry.getKey());
supervisor.supervise(entry.getValue(),
new SupervisorPolicy.AlwaysRestartPolicy(),
LifecycleState.START);
} catch (Exception e) {
logger.error("Error while starting {}", entry.getValue(), e);
}
}
/*
* Wait for all channels to start.
*/
for (Channel ch : materializedConfiguration.getChannels().values()) {
while (ch.getLifecycleState() != LifecycleState.START
&& !supervisor.isComponentInErrorState(ch)) {
try {
logger.info("Waiting for channel: " + ch.getName()
+ " to start. Sleeping for 500 ms");
Thread.sleep(500);
} catch (InterruptedException e) {
logger.error(
"Interrupted while waiting for channel to start.",
e);
Throwables.propagate(e);
}
}
}
for (Entry<String, SinkRunner> entry : materializedConfiguration
.getSinkRunners().entrySet()) {
try {
logger.info("Starting Sink " + entry.getKey());
supervisor.supervise(entry.getValue(),
new SupervisorPolicy.AlwaysRestartPolicy(),
LifecycleState.START);
} catch (Exception e) {
logger.error("Error while starting {}", entry.getValue(), e);
}
}
for (Entry<String, SourceRunner> entry : materializedConfiguration
.getSourceRunners().entrySet()) {
try {
logger.info("Starting Source " + entry.getKey());
supervisor.supervise(entry.getValue(),
new SupervisorPolicy.AlwaysRestartPolicy(),
LifecycleState.START);
} catch (Exception e) {
logger.error("Error while starting {}", entry.getValue(), e);
}
}
this.loadMonitoring();
}
其中有1個this.loadMonitoring();來啟動監控方法loadMonitoring():
private void loadMonitoring() {
Properties systemProps = System.getProperties();
Set<String> keys = systemProps.stringPropertyNames();
try {
if (keys.contains(CONF_MONITOR_CLASS)) {
String monitorType = systemProps
.getProperty(CONF_MONITOR_CLASS);
Class<? extends MonitorService> klass;
try {
// Is it a known type?
klass = MonitoringType.valueOf(monitorType.toUpperCase())
.getMonitorClass();
} catch (Exception e) {
// Not a known type, use FQCN
klass = (Class<? extends MonitorService>) Class
.forName(monitorType);
}
this.monitorServer = klass.newInstance();
Context context = new Context();
for (String key : keys) {
if (key.startsWith(CONF_MONITOR_PREFIX)) {
context.put(
key.substring(CONF_MONITOR_PREFIX.length()),
systemProps.getProperty(key));
}
}
monitorServer.configure(context);
monitorServer.start();
}
} catch (Exception e) {
logger.warn("Error starting monitoring. "
+ "Monitoring might not be available.", e);
}
}
其中monitorServer.configure(context);來加載監控服務的配置信息,monitorServer.start();啟動監控服務。
這里的monitorServer就會有兩種:GangliaServer和HTTPMetricsServer,他們都實現了MonitorService這個接口。這里我們只追蹤HTTPMetricsServer。
我們先看HTTPMetricsServer的源碼:
public class HTTPMetricsServer implements MonitorService {
private Server jettyServer;
private int port;
private static Logger LOG = LoggerFactory.getLogger(HTTPMetricsServer.class);
public static int DEFAULT_PORT = 41414;
public static String CONFIG_PORT = "port";
@Override
public void start() {
jettyServer = new Server();
//We can use Contexts etc if we have many urls to handle. For one url,
//specifying a handler directly is the most efficient.
SelectChannelConnector connector = new SelectChannelConnector();
connector.setReuseAddress(true);
connector.setPort(port);
jettyServer.setConnectors(new Connector[] {connector});
jettyServer.setHandler(new HTTPMetricsHandler());
try {
jettyServer.start();
while (!jettyServer.isStarted()) {
Thread.sleep(500);
}
} catch (Exception ex) {
LOG.error("Error starting Jetty. JSON Metrics may not be available.", ex);
}
}
@Override
public void stop() {
try {
jettyServer.stop();
jettyServer.join();
} catch (Exception ex) {
LOG.error("Error stopping Jetty. JSON Metrics may not be available.", ex);
}
}
@Override
public void configure(Context context) {
port = context.getInteger(CONFIG_PORT, DEFAULT_PORT);
}
private class HTTPMetricsHandler extends AbstractHandler {
Type mapType =
new TypeToken<Map<String, Map<String, String>>>() {
}.getType();
Gson gson = new Gson();
@Override
public void handle(String target,
HttpServletRequest request,
HttpServletResponse response,
int dispatch) throws IOException, ServletException {
// /metrics is the only place to pull metrics.
//If we want to use any other url for something else, we should make sure
//that for metrics only /metrics is used to prevent backward
//compatibility issues.
if(request.getMethod().equalsIgnoreCase("TRACE") || request.getMethod()
.equalsIgnoreCase("OPTIONS")) {
response.sendError(HttpServletResponse.SC_FORBIDDEN);
response.flushBuffer();
((Request) request).setHandled(true);
return;
}
if (target.equals("/")) {
response.setContentType("text/html;charset=utf⑻");
response.setStatus(HttpServletResponse.SC_OK);
response.getWriter().write("For Flume metrics please click"
+ " <a href = \"./metrics\"> here</a>.");
response.flushBuffer();
((Request) request).setHandled(true);
return;
} else if (target.equalsIgnoreCase("/metrics")) {
response.setContentType("application/json;charset=utf⑻");
response.setStatus(HttpServletResponse.SC_OK);
Map<String, Map<String, String>> metricsMap = JMXPollUtil.getAllMBeans();
String json = gson.toJson(metricsMap, mapType);
response.getWriter().write(json);
response.flushBuffer();
((Request) request).setHandled(true);
return;
}
response.sendError(HttpServletResponse.SC_NOT_FOUND);
response.flushBuffer();
//Not handling the request returns a Not found error page.
}
}
}
其中會初始化1個jettyServer來提供監控數據的訪問服務,里面的核心方法還是handle方法,定義了監控數據訪問的url,這里的url就是獲得監控json格式數據的http地址。那這些監控數據是如何得到的呢?
通過源碼我們可以看到Map<String, Map<String, String>> metricsMap = JMXPollUtil.getAllMBeans();具體的數據都是從這條語句得來的,再仔細看可以得知,這些監控數據是同JMX的方式得到的。至于里面具體實現的細節,相對照較復雜,同時也不屬于我們討論的范疇,所以這里不討論這塊。
除以上的源碼,我們需要關注之外,我們還需要關注具體監控組件的源碼,這些源碼都是在flume-ng-core中的org.apache.flume.instrumentation包下面,所有的監控組件都會繼承MonitoredCounterGroup實現xxxCounterMBean接口,MonitoredCounterGroup中定義了1些基本公有的監控屬性,xxxCounterMBean定義了獲得監控元素的方法接口,具體實現還是在監控組件中實現。我們看MonitoredCounterGroup的源碼:
public abstract class MonitoredCounterGroup {
private static final Logger logger =
LoggerFactory.getLogger(MonitoredCounterGroup.class);
// Key for component's start time in MonitoredCounterGroup.counterMap
private static final String COUNTER_GROUP_START_TIME = "start.time";
// key for component's stop time in MonitoredCounterGroup.counterMap
private static final String COUNTER_GROUP_STOP_TIME = "stop.time";
private final Type type;
private final String name;
private final Map<String, AtomicLong> counterMap;
private AtomicLong startTime;
private AtomicLong stopTime;
private volatile boolean registered = false;
protected MonitoredCounterGroup(Type type, String name, String... attrs) {
this.type = type;
this.name = name;
Map<String, AtomicLong> counterInitMap = new HashMap<String, AtomicLong>();
// Initialize the counters
for (String attribute : attrs) {
counterInitMap.put(attribute, new AtomicLong(0L));
}
counterMap = Collections.unmodifiableMap(counterInitMap);
startTime = new AtomicLong(0L);
stopTime = new AtomicLong(0L);
}
/**
* Starts the component
*
* Initializes the values for the stop time as well as all the keys in the
* internal map to zero and sets the start time to the current time in
* milliseconds since midnight January 1, 1970 UTC
*/
public void start() {
register();
stopTime.set(0L);
for (String counter : counterMap.keySet()) {
counterMap.get(counter).set(0L);
}
startTime.set(System.currentTimeMillis());
logger.info("Component type: " + type + ", name: " + name + " started");
}
/**
* Registers the counter.
* This method is exposed only for testing, and there should be no need for
* any implementations to call this method directly.
*/
@VisibleForTesting
void register() {
if (!registered) {
try {
ObjectName objName = new ObjectName("org.apache.flume."
+ type.name().toLowerCase() + ":type=" + this.name);
if (ManagementFactory.getPlatformMBeanServer().isRegistered(objName)) {
logger.debug("Monitored counter group for type: " + type + ", name: "
+ name + ": Another MBean is already registered with this name. "
+ "Unregistering that pre-existing MBean now...");
ManagementFactory.getPlatformMBeanServer().unregisterMBean(objName);
logger.debug("Monitored counter group for type: " + type + ", name: "
+ name + ": Successfully unregistered pre-existing MBean.");
}
ManagementFactory.getPlatformMBeanServer().registerMBean(this, objName);
logger.info("Monitored counter group for type: " + type + ", name: "
+ name + ": Successfully registered new MBean.");
registered = true;
} catch (Exception ex) {
logger.error("Failed to register monitored counter group for type: "
+ type + ", name: " + name, ex);
}
}
}
/**
* Shuts Down the Component
*
* Used to indicate that the component is shutting down.
*
* Sets the stop time and then prints out the metrics from
* the internal map of keys to values for the following components:
*
* - ChannelCounter
* - ChannelProcessorCounter
* - SinkCounter
* - SinkProcessorCounter
* - SourceCounter
*/
public void stop() {
// Sets the stopTime for the component as the current time in milliseconds
stopTime.set(System.currentTimeMillis());
// Prints out a message indicating that this component has been stopped
logger.info("Component type: " + type + ", name: " + name + " stopped");
// Retrieve the type for this counter group
final String typePrefix = type.name().toLowerCase();
// Print out the startTime for this component
logger.info("Shutdown Metric for type: " + type + ", "
+ "name: " + name + ". "
+ typePrefix + "." + COUNTER_GROUP_START_TIME
+ " == " + startTime);
// Print out the stopTime for this component
logger.info("Shutdown Metric for type: " + type + ", "
+ "name: " + name + ". "
+ typePrefix + "." + COUNTER_GROUP_STOP_TIME
+ " == " + stopTime);
// Retrieve and sort counter group map keys
final List<String> mapKeys = new ArrayList<String>(counterMap.keySet());
Collections.sort(mapKeys);
// Cycle through and print out all the key value pairs in counterMap
for (final String counterMapKey : mapKeys) {
// Retrieves the value from the original counterMap.
final long counterMapValue = get(counterMapKey);
logger.info("Shutdown Metric for type: " + type + ", "
+ "name: " + name + ". "
+ counterMapKey + " == " + counterMapValue);
}
}
/**
* Returns when this component was first started
*
* @return
*/
public long getStartTime() {
return startTime.get();
}
/**
* Returns when this component was stopped
*
* @return
*/
public long getStopTime() {
return stopTime.get();
}
@Override
public final String toString() {
StringBuilder sb = new StringBuilder(type.name()).append(":");
sb.append(name).append("{");
boolean first = true;
Iterator<String> counterIterator = counterMap.keySet().iterator();
while (counterIterator.hasNext()) {
if (first) {
first = false;
} else {
sb.append(", ");
}
String counterName = counterIterator.next();
sb.append(counterName).append("=").append(get(counterName));
}
sb.append("}");
return sb.toString();
}
/**
* Retrieves the current value for this key
*
* @param counter The key for this metric
* @return The current value for this key
*/
protected long get(String counter) {
return counterMap.get(counter).get();
}
/**
* Sets the value for this key to the given value
*
* @param counter The key for this metric
* @param value The new value for this key
*/
protected void set(String counter, long value) {
counterMap.get(counter).set(value);
}
/**
* Atomically adds the delta to the current value for this key
*
* @param counter The key for this metric
* @param delta
* @return The updated value for this key
*/
protected long addAndGet(String counter, long delta) {
return counterMap.get(counter).addAndGet(delta);
}
/**
* Atomically increments the current value for this key by one
*
* @param counter The key for this metric
* @return The updated value for this key
*/
protected long increment(String counter) {
return counterMap.get(counter).incrementAndGet();
}
/**
* Component Enum Constants
*
* Used by each component's constructor to distinguish which type the
* component is.
*/
public static enum Type {
SOURCE,
CHANNEL_PROCESSOR,
CHANNEL,
SINK_PROCESSOR,
SINK,
INTERCEPTOR,
SERIALIZER,
OTHER
};
public String getType(){
return type.name();
}
}
其中主要包括:
初始化構造方法protected MonitoredCounterGroup(Type type, String name, String... attrs):初始化組件類型,和1些監控元素;
啟動方法start():啟動監控組件;
停止方法stop():停止監控組件;
監控組件的注冊方法register():監控組件必須在監控服務MBeanServer中注冊以后才能正常監控。
然后我們看獲得監控元素信息的方法接口,我們以SourceCounterMBean為例子:
public interface SourceCounterMBean {
long getEventReceivedCount();
long getEventAcceptedCount();
long getAppendReceivedCount();
long getAppendAcceptedCount();
long getAppendBatchReceivedCount();
long getAppendBatchAcceptedCount();
long getStartTime();
long getStopTime();
String getType();
long getOpenConnectionCount();
String getIp();
String getPort();
}
如果我們要自定義監控元素,除在監控組件(xxxCounter)中定義監控屬性之外,在這里(xxxCounterMBean)也必須要定義1個獲得值得方法。
我們以flume中AvroSource的監控為例子,監控對象是AvroSource,與監控有關的類有SourceCounter、SourceCounterMBean、MonitoredCounterGroup這3個,其中SourceCounter是我們的監控組件,它繼承MonitoredCounterGroup并且實現SourceCounterMBean接口,具體要監控的元素是在SourceCounter、MonitoredCounterGroup這兩個類中定義的,獲得監控元素的方法是在SourceCounterMBean接口中定義的,然后我們會在AvroSource類中初始化1個我們的監控組件SourceCounter,所有的監控元素的值都是在監控對象AvroSource中設值,然后獲得值是通過SourceCounterMBean的接口方法來獲得。
具體的監控數據流向圖:
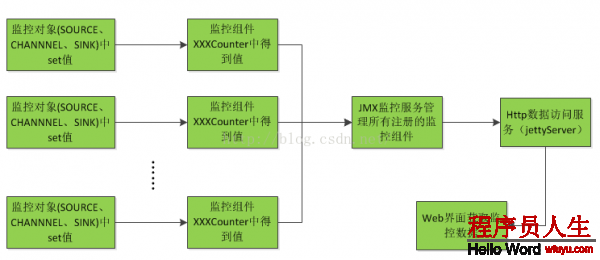
熟習了以上的流程,我們也能夠開發自己想要的監控組件,得到完全滿足自己需求的所有監控元素。
這里如果只是在原有基礎之上添加1些組件的監控元素,比較簡單,只需要在監控組件(xxxCounter)中添加你需要的監控元素屬性,然后在(xxxCounterMBean)中添加get方法(只有這里添加get方法,JMX監控服務才能順利獲得到值),然后在相應的組件(source、channel、sink)中set值。
如果是自定義監控組件,你只需要添加xxxCounter、xxxCounterMBean,和你自定義的xxx(source、channel、sink),這里需要注意1點,就是命名規范的問題,需要嚴格依照上面的命令規范JMX才能正常辨認。例如,這里如果你把獲得值得接口類xxxCounterMBean命名為xxxCounterMbean,這樣就出問題。
flume監控數據截圖:
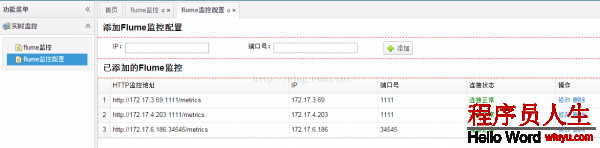
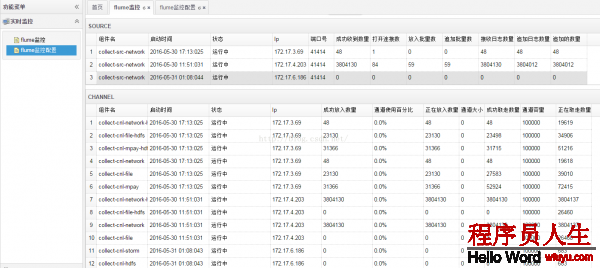
flume監控web頁面:
生活不易,碼農辛苦
如果您覺得本網站對您的學習有所幫助,可以手機掃描二維碼進行捐贈