World Wind Java開發之十――AnalyticSurface柵格渲染
來源:程序員人生 發布時間:2015-03-03 07:48:23 閱讀次數:5168次
1、AnalyticSurfaceDemo
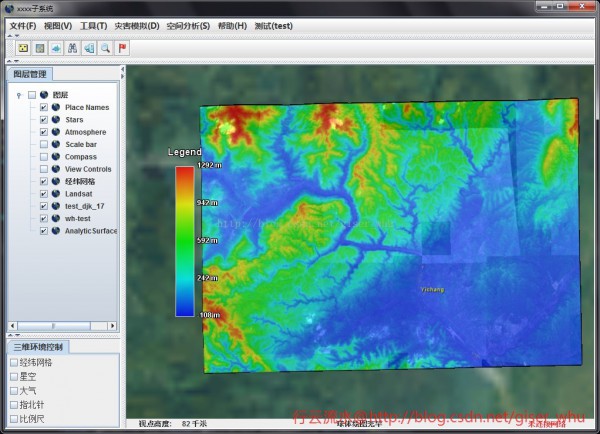
ArcGIS下對柵格的各種分級渲染效果是非常好的,可以做出很漂亮的圖,現在在WW下也能夠做出一樣的效果了,看到這里是否是有點小興奮呢。先看下WW自帶的AnalyticSurfaceDemo的運行效果圖:
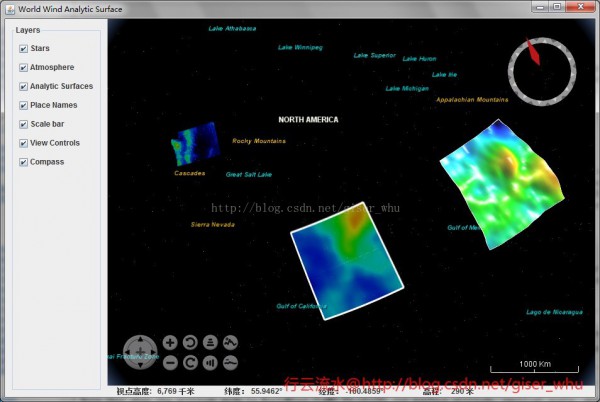
通過看源代碼可以知道給出了3種渲染示例,其中兩種是動態的,這里我需要的是對dem數據或是單波段影象的渲染,也就是左上方的渲染效果。
2、AnalyticSurface類
下面來看下主要用到的類:
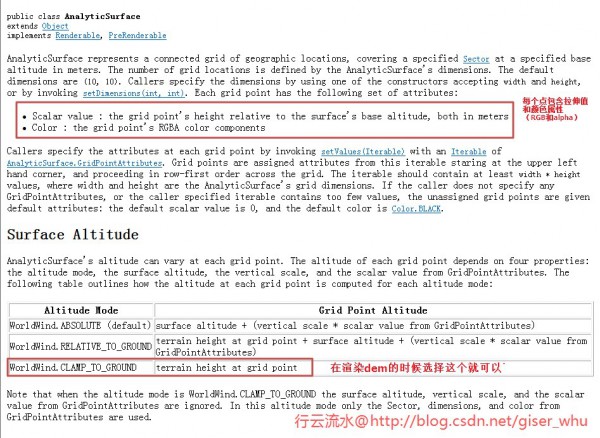
主要用到的方法:
// 創建AnalyticSurface并設置其屬性
final AnalyticSurface surface = new AnalyticSurface();
surface.setSector(raster.getSector());
surface.setDimensions(raster.getWidth(), raster.getHeight());
surface.setValues(AnalyticSurface.createColorGradientValues(
raster.getBuffer(), raster.getTransparentValue(), extremes[0],
extremes[1], minHue, maxHue));
// surface.setVerticalScale(5e3);
// 設置表面渲染方式為 CLAMP_TO_GROUND
surface.setAltitudeMode(WorldWind.CLAMP_TO_GROUND);
根據自己的需要可以查閱開發文檔設置其他屬性。
3、DEM渲染實例
將demo中的代碼略加修改封裝為AnalyticSurfaceUtil類以供后面所有柵格數據的渲染使用,目前比較簡單,后面陸續擴充該類。
WW下渲染效果:
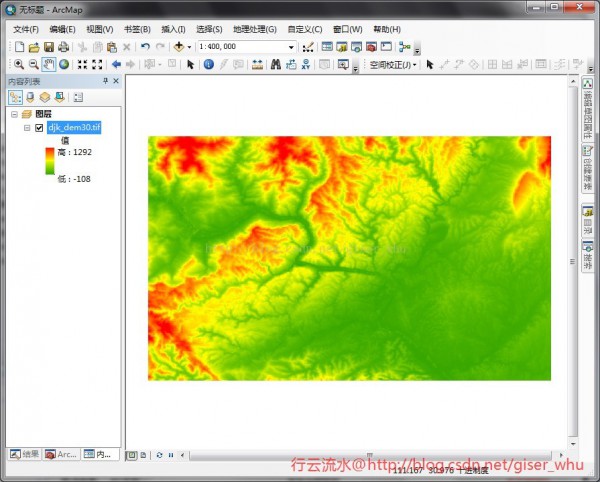
ArcMap下渲染效果:
可以看到WW下渲染的效果絲絕不遜色,圖是否是很漂亮呢。
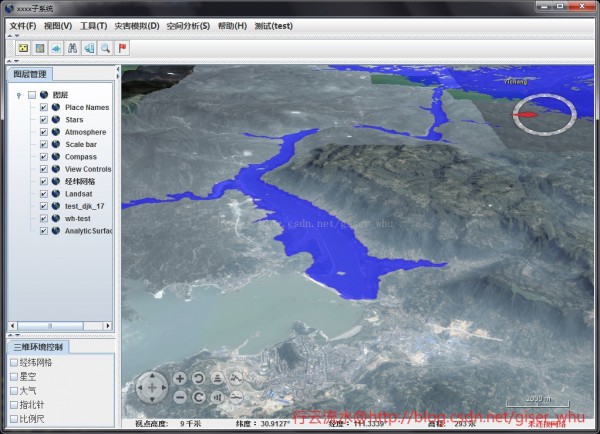
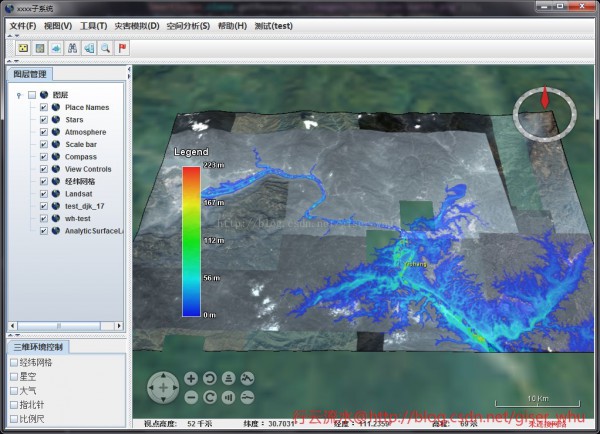
4、洪澇摹擬渲染
這是對之前洪澇摹擬的改進,對洪澇摹擬輸出的范圍圖和深度圖進行渲染。
(1)范圍圖
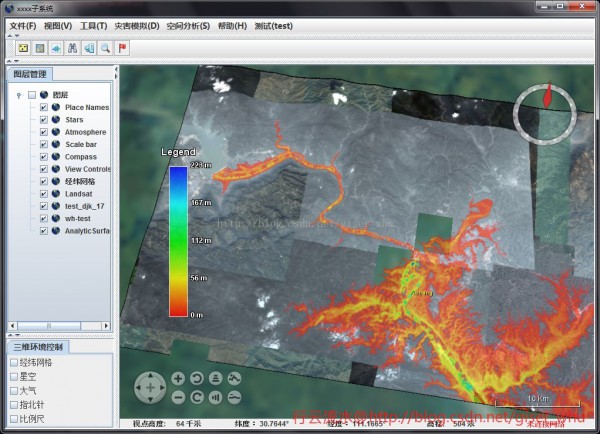
(2)深度圖
這幅渲染的深度圖是否是有種火山噴發的感覺,很有藝術美感,非常喜歡這個渲染的效果。改1下配色再看下另外一種渲染效果:
5、源碼。
下面是自己封裝的AnalyticSurfaceUtil類,供大家參考:
/**
* @Copyright 2014⑵020 @劉碩
**/
package edu.whu.vge.util;
import gov.nasa.worldwind.WorldWind;
import gov.nasa.worldwind.avlist.AVKey;
import gov.nasa.worldwind.avlist.AVList;
import gov.nasa.worldwind.data.BufferWrapperRaster;
import gov.nasa.worldwind.data.DataRaster;
import gov.nasa.worldwind.data.DataRasterReader;
import gov.nasa.worldwind.data.DataRasterReaderFactory;
import gov.nasa.worldwind.exception.WWRuntimeException;
import gov.nasa.worldwind.geom.Extent;
import gov.nasa.worldwind.geom.Sector;
import gov.nasa.worldwind.layers.RenderableLayer;
import gov.nasa.worldwind.render.DrawContext;
import gov.nasa.worldwind.render.Renderable;
import gov.nasa.worldwind.util.Logging;
import gov.nasa.worldwind.util.WWBufferUtil;
import gov.nasa.worldwind.util.WWIO;
import gov.nasa.worldwind.util.WWMath;
import gov.nasa.worldwindx.examples.analytics.AnalyticSurface;
import gov.nasa.worldwindx.examples.analytics.AnalyticSurfaceAttributes;
import gov.nasa.worldwindx.examples.analytics.AnalyticSurfaceLegend;
import gov.nasa.worldwindx.examples.util.ExampleUtil;
import java.awt.Point;
import java.io.File;
import java.text.DecimalFormat;
import java.text.FieldPosition;
import java.text.Format;
import javax.swing.SwingUtilities;
/**
* @項目名稱:SmartScope
* @類名稱:AnalyticSurfaceUtil
* @類描寫:
* @創建人:劉碩
* @創建時間:2015⑴⑵1 下午3:40:54
* @修改備注:
* @版本:
*/
public class AnalyticSurfaceUtil
{
/**
* 創建1個新的實例 AnalyticSurfaceUtil.
*
*/
public AnalyticSurfaceUtil()
{
// TODO Auto-generated constructor stub
}
public static void createPrecipitationSurface(double minHue, double maxHue,
final RenderableLayer outLayer)
{
String DATA_PATH = "J:/data/wwj/FloodDepth.tif";
BufferWrapperRaster raster = loadRasterElevations(DATA_PATH);
if (raster == null)
return;
// 獲得像元最大值與最小值
double[] extremes = WWBufferUtil.computeExtremeValues(
raster.getBuffer(), raster.getTransparentValue());
if (extremes == null)
return;
// 創建AnalyticSurface并設置其屬性
final AnalyticSurface surface = new AnalyticSurface();
surface.setSector(raster.getSector());
surface.setDimensions(raster.getWidth(), raster.getHeight());
surface.setValues(AnalyticSurface.createColorGradientValues(
raster.getBuffer(), raster.getTransparentValue(), extremes[0],
extremes[1], minHue, maxHue));
// surface.setVerticalScale(5e3);
// 設置表面渲染方式為 CLAMP_TO_GROUND
surface.setAltitudeMode(WorldWind.CLAMP_TO_GROUND);
AnalyticSurfaceAttributes attr = new AnalyticSurfaceAttributes();
attr.setDrawOutline(false);
attr.setDrawShadow(false);
attr.setInteriorOpacity(0.6);
surface.setSurfaceAttributes(attr);
// 設置圖例樣式
Format legendLabelFormat = new DecimalFormat("# m")
{
public StringBuffer format(double number, StringBuffer result,
FieldPosition fieldPosition)
{
double valueInFeet = number;
return super.format(valueInFeet, result, fieldPosition);
}
};
// 創建圖例
final AnalyticSurfaceLegend legend = AnalyticSurfaceLegend.fromColorGradient(
extremes[0], extremes[1], minHue, maxHue,
AnalyticSurfaceLegend.createDefaultColorGradientLabels(
extremes[0], extremes[1], legendLabelFormat),
AnalyticSurfaceLegend.createDefaultTitle("Legend"));
legend.setOpacity(0.8);
legend.setScreenLocation(new Point(100, 300));
SwingUtilities.invokeLater(new Runnable()
{
public void run()
{
surface.setClientLayer(outLayer);
outLayer.addRenderable(surface);
outLayer.addRenderable(createLegendRenderable(surface, 600,
legend));
}
});
}
/**
*
* @方法名稱: loadRasterElevations ;
* @方法描寫: 讀取數據(單波段) ;
* @參數 :@param path
* @參數 :@return
* @返回類型: BufferWrapperRaster ;
* @創建人:劉碩;
* @創建時間:2015⑴⑵2 上午11:25:40;
* @throws
*/
public static BufferWrapperRaster loadRasterElevations(String path)
{
// Download the data and save it in a temp file.
File file = ExampleUtil.saveResourceToTempFile(path,
"." + WWIO.getSuffix(path));
// Create a raster reader for the file type.
DataRasterReaderFactory readerFactory = (DataRasterReaderFactory) WorldWind.createConfigurationComponent(AVKey.DATA_RASTER_READER_FACTORY_CLASS_NAME);
DataRasterReader reader = readerFactory.findReaderFor(file, null);
try
{
// Before reading the raster, verify that the file contains
// elevations.
AVList metadata = reader.readMetadata(file, null);
if (metadata == null
|| !AVKey.ELEVATION.equals(metadata.getStringValue(AVKey.PIXEL_FORMAT)))
{
String msg = Logging.getMessage(
"ElevationModel.SourceNotElevations",
file.getAbsolutePath());
Logging.logger().severe(msg);
throw new IllegalArgumentException(msg);
}
// Read the file into the raster.
DataRaster[] rasters = reader.read(file, null);
if (rasters == null || rasters.length == 0)
{
String msg = Logging.getMessage(
"ElevationModel.CannotReadElevations",
file.getAbsolutePath());
Logging.logger().severe(msg);
throw new WWRuntimeException(msg);
}
// Determine the sector covered by the elevations. This
// information
// is in the GeoTIFF file or auxiliary
// files associated with the elevations file.
Sector sector = (Sector) rasters[0].getValue(AVKey.SECTOR);
if (sector == null)
{
String msg = Logging.getMessage("DataRaster.MissingMetadata",
AVKey.SECTOR);
Logging.logger().severe(msg);
throw new IllegalArgumentException(msg);
}
// Request a sub-raster that contains the whole file. This step
// is
// necessary because only sub-rasters
// are reprojected (if necessary); primary rasters are not.
int width = rasters[0].getWidth();
int height = rasters[0].getHeight();
DataRaster subRaster = rasters[0].getSubRaster(width, height,
sector, rasters[0]);
// Verify that the sub-raster can create a ByteBuffer, then
// create
// one.
if (!(subRaster instanceof BufferWrapperRaster))
{
String msg = Logging.getMessage(
"ElevationModel.CannotCreateElevationBuffer", path);
Logging.logger().severe(msg);
throw new WWRuntimeException(msg);
}
return (BufferWrapperRaster) subRaster;
}
catch (Exception e)
{
e.printStackTrace();
return null;
}
}
/**
*
* @方法名稱: createLegendRenderable ;
* @方法描寫: 創建圖例 ;
* @參數 :@param surface
* @參數 :@param surfaceMinScreenSize
* @參數 :@param legend
* @參數 :@return
* @返回類型: Renderable ;
* @創建人:劉碩;
* @創建時間:2015⑴⑵2 上午11:26:07;
* @throws
*/
protected static Renderable createLegendRenderable(
final AnalyticSurface surface, final double surfaceMinScreenSize,
final AnalyticSurfaceLegend legend)
{
return new Renderable()
{
public void render(DrawContext dc)
{
Extent extent = surface.getExtent(dc);
if (!extent.intersects(dc.getView().getFrustumInModelCoordinates()))
return;
if (WWMath.computeSizeInWindowCoordinates(dc, extent) < surfaceMinScreenSize)
return;
legend.render(dc);
}
};
}
}
目前還很不完善,后面有需要的話打算做1個類似于ArcGIS的分級渲染工具,對降雨量蒸散發量等數據都可以很方便的進行渲染。
生活不易,碼農辛苦
如果您覺得本網站對您的學習有所幫助,可以手機掃描二維碼進行捐贈