-
背景需求
-
繪制效果
-
實(shí)現(xiàn)思路
-
關(guān)鍵技術(shù)
-
完全代碼
背景需求
使用D3繪制圖表1般都會(huì)繪制1個(gè)坐標(biāo)軸,但是用D3畫過(guò)圖的同學(xué)都知道默許情況下繪制的坐標(biāo)軸刻度是英文的。但是我們要的刻度是中文的。怎樣辦呢?且看本文講授如何繪制本地時(shí)間軸。
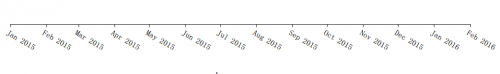
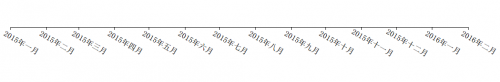
繪制效果
實(shí)現(xiàn)效果如何,先來(lái)1睹為快!
d3.time.format("%b %Y")
zh.timeFormat("%Y年%b")
實(shí)現(xiàn)思路
思路很簡(jiǎn)單:
-
定義簡(jiǎn)體中文本地化
-
用本地時(shí)間格式化函數(shù)格式化數(shù)軸的刻度值
關(guān)鍵技術(shù)
var zh = d3.locale({
decimal: ".",
thousands: ",",
grouping: [3],
currency: ["¥", ""],
dateTime: "%a %b %e %X %Y",
date: "%Y/%-m/%-d",
time: "%H:%M:%S",
periods: ["上午", "下午"],
days: ["星期日", "星期1", "星期2", "星期3", "星期4", "星期5", "星期6"],
shortDays: ["星期日", "星期1", "星期2", "星期3", "星期4", "星期5", "星期6"],
months: ["1月", "2月", "3月", "4月", "5月", "6月", "7月", "8月", "9月", "10月", "101月", "102月"],
shortMonths: ["1月", "2月", "3月", "4月", "5月", "6月", "7月", "8月", "9月", "10月", "101月", "102月"]
});
var timeScale = d3.time.scale()
.domain([new Date(2015, 0, 1), new Date(2016, 1, 1)])
.range([0, width-40]);
var axis = d3.svg.axis()
.scale(timeScale)
.tickFormat(zh.timeFormat("%Y年%b")) .orient("bottom")
var svg = d3.select("body").append("svg")
.attr("width", width+200)
.attr("height", height)
.append("g")
.attr("class", "axis")
.attr("transform", "translate(" + 20 + "," + height/2 + ")")
.call(axis);
d3.selectAll(g.tick text).attr(transform,translate(30,20)rotate(30))
本例很簡(jiǎn)單,可使用下面的代碼測(cè)試效果,你學(xué)會(huì)了嗎?
完全代碼
<meta charset="utf⑻"> <style> body{ font-weight:bold; } .axis path, .axis line { fill: none; stroke: #000; shape-rendering: crispEdges; } style> <body> <script src="../../d3.js">script> <script> var zh = d3.locale({
decimal: ".",
thousands: ",",
grouping: [3],
currency: ["¥", ""],
dateTime: "%a %b %e %X %Y",
date: "%Y/%-m/%-d",
time: "%H:%M:%S",
periods: ["上午", "下午"],
days: ["星期日", "星期1", "星期2", "星期3", "星期4", "星期5", "星期6"],
shortDays: ["星期日", "星期1", "星期2", "星期3", "星期4", "星期5", "星期6"],
months: ["1月", "2月", "3月", "4月", "5月", "6月", "7月", "8月", "9月", "10月", "101月", "102月"],
shortMonths: ["1月", "2月", "3月", "4月", "5月", "6月", "7月", "8月", "9月", "10月", "101月", "102月"]
}); var width = 1000,height = 500; var timeScale = d3.time.scale()
.domain([new Date(2015, 0, 1), new Date(2016, 1, 1)])
.range([0, width-40]); var axis = d3.svg.axis()
.scale(timeScale)
.tickFormat(zh.timeFormat("%Y年%b"))
.orient("bottom") var svg = d3.select("body").append("svg")
.attr("width", width+200)
.attr("height", height)
.append("g")
.attr("class", "axis")
.attr("transform", "translate(" + 20 + "," + height/2 + ")")
.call(axis); d3.selectAll(g.tick text).attr(transform,translate(30,20)rotate(30)) script>