
這是1個(gè)多元回歸方程用于揭露汽車油耗和汽車屬性之間的關(guān)系,試圖回答常見的問題:是不是自動(dòng)檔的汽車更費(fèi)油?除自動(dòng)檔這個(gè)屬性,還有其他屬性和汽車耗油之間的關(guān)系更大嗎?原文見于RPubshere.
分析基于R語言,mtcars小數(shù)據(jù)集(可以擴(kuò)大到更大數(shù)據(jù)集),希望對(duì)讀者有所幫助。
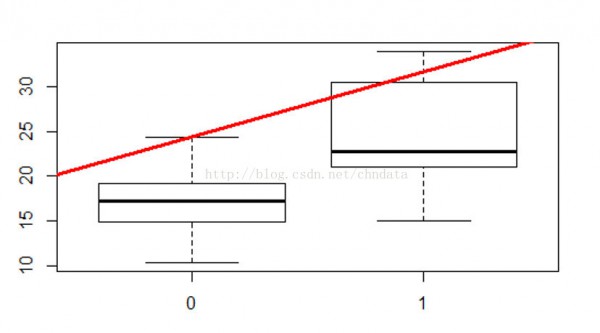
In this part, we setup a regression model between transmissions and MPG. And below are the first 6 records of data.
## Valiant 18.1 6 225 105 2.76 3.460 20.22 1 0 3 1
There's obvious difference between these 2 variables compared their highest, mean and lowest value pairs. On any level, the manual transmission cars has a bigger MPG value.(0 for automatic and 1 for manual).
And We could also find the trend has a positive slope that means when transmission increases one unit(from 0 to 1), or to say from automatic to manual, the MPG value will increase.
Quantitative Difference
fit=lm(mtcars$mpg~factor(mtcars$am))
fit
##
## Call:
## lm(formula = mtcars$mpg ~ factor(mtcars$am))
##
## Coefficients:
## (Intercept) factor(mtcars$am)1
## 17.147 7.245
Here, the intercept 17.147 is a virtual value when the regression model created, which can be regarded as a meaningless value used only for model creation(transmission equals negative value), and the slope 7.245 means every one unit increase of transmission
will beget 7.245 units increase of MPG, or to say manual transmision cars has a higher MPG 7.245 than the automatic cars in general.
Getting a confidence interval
sumCoef <- summary(fit)$coefficients
sumCoef[2,1] + c(⑴, 1) * qt(.975, df = fit$df) * sumCoef[2, 2]
## [1] 3.64151 10.84837
It shows the 95% confidence is 3.64151~10.84837, that make us confident for the conclusion that manual transmission have a higher MPG than automatic ones.
Residual Plot and diagnostic
Now, draw a residual point plot.
plot(mtcars$am, resid(lm(mtcars$mpg ~ factor(mtcars$am))))
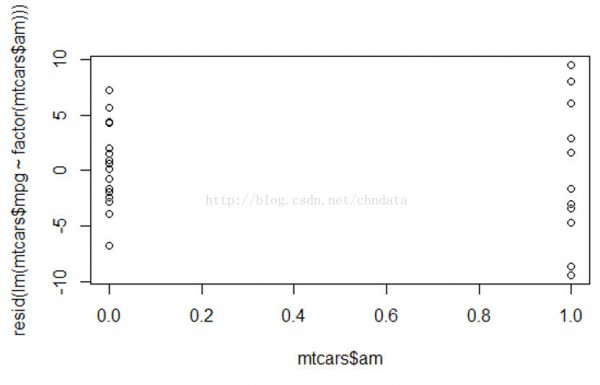
As the plot shows both transmissions have a very scattered (⑴0,10 for manual ) or (⑺.5,7.5 automatic) residual, which means our model may be influenced by other variables and let's do more research.
Analysis phase II:
Now, we try to introduce other variables along with transmission. Since if the number of variables is greater than 2 will confuse customers rather than help them, so our purpose is finding one of the most useful variable along with transmission. #### Variables
choosen Here are all variables that could influence MPG.
wt - Car Weight (lb/1000)
gear - Number of forward gears
carb - Number of carburetors
hp - Gross horsepower
cyl - Number of cylinders
Create models based on transmission plus one more variable
fit0<-lm(mpg ~ factor(am) , data = mtcars)
fit1<-lm(mpg ~ factor(am)+wt , data = mtcars)
fit2<-lm(mpg ~ factor(am)+gear , data = mtcars)
fit3<-lm(mpg ~ factor(am)+carb , data = mtcars)
fit4<-lm(mpg ~ factor(am)+hp , data = mtcars)
fit5<-lm(mpg ~ factor(am)+factor(cyl) , data = mtcars)
Get significance value of each variable
at1<-anova(fit1);at2<-anova(fit2);at3<-anova(fit3);at4<-anova(fit4);at5<-anova(fit5)
Show P-Value results
For those variable with P-value >5%, that means it's not significant to be introduced with the better fitted model.
at1$Pr[2];at2$Pr[2];at3$Pr[2];at4$Pr[2];at5$Pr[2]
## [1] 1.867415e-07
## [1] 0.9651278
## [1] 2.752235e-06
## [1] 2.920375e-08
## [1] 8.010109e-07
From the result, we know all 4 variables may influence MPG except the second one gear.
Fit he best model
summary(fit1)$coef;summary(fit3)$coef;summary(fit4)$coef;summary(fit5)$coef
## Estimate Std. Error t value Pr(>|t|)
## (Intercept) 37.32155131 3.0546385 12.21799285 5.843477e⑴3
## factor(am)1 -0.02361522 1.5456453 -0.01527855 9.879146e-01
## wt ⑸.35281145 0.7882438 ⑹.79080719 1.867415e-07
## Estimate Std. Error t value Pr(>|t|)
## (Intercept) 23.145836 1.294133 17.885213 3.315382e⑴7
## factor(am)1 7.653119 1.222958 6.257873 7.870255e-07
## carb ⑵.191748 0.377814 ⑸.801129 2.752235e-06
## Estimate Std. Error t value Pr(>|t|)
## (Intercept) 26.5849137 1.425094292 18.654845 1.073954e⑴7
## factor(am)1 5.2770853 1.079540576 4.888270 3.460318e-05
## hp -0.0588878 0.007856745 ⑺.495191 2.920375e-08
## Estimate Std. Error t value Pr(>|t|)
## (Intercept) 24.801852 1.322615 18.752135 2.182425e⑴7
## factor(am)1 2.559954 1.297579 1.972869 5.845717e-02
## factor(cyl)6 ⑹.156118 1.535723 ⑷.008612 4.106131e-04
## factor(cyl)8 ⑴0.067560 1.452082 ⑹.933187 1.546574e-07
Interpreter of the best second variable.
Based on the results from all 4 variables, the weight variables even reverse the effect of transmission so it could be removed from our model. The 3rd one carb doesn't impact the transmission so obviously (in this case, the transmission slope is about 7, same
as the original model contains only one variable transmission), the 4th hp have a very small influence with very small slope, while the last variable cyl does impact much, its slope is smaller than ⑹ (for different number of cylinders, their slopes are ⑹.16
and ⑴0.07) . That means the number of cylinders are significant for MPG and the more number of cylinders, the lower MPG it gets.
Conclusion
Now we could answer the most asked question confidently, the manual transmission will really get a higher MPG, besides this concern, cars with smaller Number of cylinders will get higher MPG as well. Hope it helps when you are choosing your car.
結(jié)論:
自動(dòng)擋汽車確切比手動(dòng)擋更耗油,除這個(gè)參數(shù),汽缸數(shù)量越多也更加耗油。
Appendix:
Whole data view of our data set:
mtcars
mpg cyl disp hp drat wt qsec vs am gear carb
Mazda RX4 21.0 6 160.0 110 3.90 2.620 16.46 0 1 4 4
Mazda RX4 Wag 21.0 6 160.0 110 3.90 2.875 17.02 0 1 4 4
Datsun 710 22.8 4 108.0 93 3.85 2.320 18.61 1 1 4 1
Hornet 4 Drive 21.4 6 258.0 110 3.08 3.215 19.44 1 0 3 1
Hornet Sportabout 18.7 8 360.0 175 3.15 3.440 17.02 0 0 3 2
Valiant 18.1 6 225.0 105 2.76 3.460 20.22 1 0 3 1
Duster 360 14.3 8 360.0 245 3.21 3.570 15.84 0 0 3 4
Merc 240D 24.4 4 146.7 62 3.69 3.190 20.00 1 0 4 2
Merc 230 22.8 4 140.8 95 3.92 3.150 22.90 1 0 4 2
Merc 280 19.2 6 167.6 123 3.92 3.440 18.30 1 0 4 4
Merc 280C 17.8 6 167.6 123 3.92 3.440 18.90 1 0 4 4
Merc 450SE 16.4 8 275.8 180 3.07 4.070 17.40 0 0 3 3
Merc 450SL 17.3 8 275.8 180 3.07 3.730 17.60 0 0 3 3
Merc 450SLC 15.2 8 275.8 180 3.07 3.780 18.00 0 0 3 3
Cadillac Fleetwood 10.4 8 472.0 205 2.93 5.250 17.98 0 0 3 4
Lincoln Continental 10.4 8 460.0 215 3.00 5.424 17.82 0 0 3 4
Chrysler Imperial 14.7 8 440.0 230 3.23 5.345 17.42 0 0 3 4
Fiat 128 32.4 4 78.7 66 4.08 2.200 19.47 1 1 4 1
Honda Civic 30.4 4 75.7 52 4.93 1.615 18.52 1 1 4 2
Toyota Corolla 33.9 4 71.1 65 4.22 1.835 19.90 1 1 4 1
Toyota Corona 21.5 4 120.1 97 3.70 2.465 20.01 1 0 3 1
Dodge Challenger 15.5 8 318.0 150 2.76 3.520 16.87 0 0 3 2
AMC Javelin 15.2 8 304.0 150 3.15 3.435 17.30 0 0 3 2
Camaro Z28 13.3 8 350.0 245 3.73 3.840 15.41 0 0 3 4
Pontiac Firebird 19.2 8 400.0 175 3.08 3.845 17.05 0 0 3 2
Fiat X1⑼ 27.3 4 79.0 66 4.08 1.935 18.90 1 1 4 1
Porsche 914⑵ 26.0 4 120.3 91 4.43 2.140 16.70 0 1 5 2
Lotus Europa 30.4 4 95.1 113 3.77 1.513 16.90 1 1 5 2
Ford Pantera L 15.8 8 351.0 264 4.22 3.170 14.50 0 1 5 4
Ferrari Dino 19.7 6 145.0 175 3.62 2.770 15.50 0 1 5 6
Maserati Bora 15.0 8 301.0 335 3.54 3.570 14.60 0 1 5 8
Volvo 142E 21.4 4 121.0 109 4.11 2.780 18.60 1 1 4 2

程序員人生,我編程,我富裕,記住wfuyu網(wǎng),php教程,php學(xué)習(xí),php手冊(cè),CMS模版制作
聲明:本站大部分內(nèi)容是作者原創(chuàng),少部分收集于互聯(lián)網(wǎng)供大家一起學(xué)習(xí),原版權(quán)很多不明,如有侵權(quán)請(qǐng)聯(lián)系本站,謝謝!
粵ICP備14040726號(hào)-1?? 2015-2020 程序員人生 版權(quán)所有


