您當前位置:
首頁 >
數據庫 >
數據庫應用 > Nagios 里面監控MySQL事務一直RUNNING沒有結束的報警Shell腳本
Nagios 里面監控MySQL事務一直RUNNING沒有結束的報警Shell腳本
來源:程序員人生 發布時間:2014-12-09 08:35:16 閱讀次數:4291次
敘言:
業務報警定單提交異常,頁面1直沒有反應,排查后是事務沒有提交或回滾致使,想到如果及時監控事務的運行狀態報警出來,那末就能夠及時排查出問題所在,方便運營處理,所以自己就弄了1個shell腳本放在nagios來處理事務報警情況。
1,編寫事務監控腳本
#!/bin/bash# author: tim.man# version: 1.0# desc: check the RUNNING TRANSACTION over ST_OK=0 ST_WR=1 ST_CR=2 ST_UK=3 TIME_TRX=10# 提示信息print_help() { echo "$PROGNAME -w INT -c INT" echo "Options:" echo " -w/--warning)" echo " Sets a warning number" echo " -c/--critical)" echo " Sets a critical level for io" exit $ST_UK }while test -n "$1"; do case "$1" in -help|-h) print_help exit $ST_UK ;; --warning|-w) warning=$2 shift ;; --critical|-c) critical=$2 shift ;; *) echo "Unknown argument: $1" print_help exit $ST_UK ;; esac shift done get_wcdiff() { if [ ! -z "$warning" -a ! -z "$critical" ] then wclvls=1 if [ ${warning} -gt ${critical} ] then wcdiff=1 fi elif [ ! -z "$warning" -a -z "$critical" ] then wcdiff=2 elif [ -z "$warning" -a ! -z "$critical" ] then wcdiff=3 fi } # 腳本判斷val_wcdiff() { if [ "$wcdiff" = 1 ] then echo "Please adjust your warning/critical thresholds. The warning must be lower than the critical level!" exit $ST_UK elif [ "$wcdiff" = 2 ] then echo "Please also set a critical value when you want to use warning/critical thresholds!" exit $ST_UK elif [ "$wcdiff" = 3 ] then echo "Please also set a warning value when you want to use warning/critical thresholds!" exit $ST_UK fi } get_wcdiff val_wcdiff # 統計mysql的事務中最大運行時間max_over_time=`/usr/local/mysql/bin/mysql --user=nagios --password="nagiosq@xxx" -NS /usr/local/mysql/mysql.sock -e "SELECT TIME_TO_SEC(TIMEDIFF(NOW(),t.trx_started)) FROM information_schema.INNODB_TRX t WHERE TIME_TO_SEC(TIMEDIFF(NOW(),t.trx_started))>$TIME_TRX ORDER BY TIME_TO_SEC(TIMEDIFF(NOW(),t.trx_started)) DESC LIMIT 1;" |awk '{print $1}'`# 如果當前沒有RUNNING的事務,則直接賦值為0,以避免下面if判斷出錯if [ ! -n "$max_over_time" ];then max_over_time=0 fi# 獲得當前所以阻塞的事務數量num_trx=`/usr/local/mysql/bin/mysql --user=nagios --password="nagiosq@xxx" -NS /usr/local/mysql/mysql.sock -e "SELECT COUNT(1) FROM information_schema.INNODB_TRX t WHERE TIME_TO_SEC(TIMEDIFF(NOW(),t.trx_started))>$TIME_TRX;" |awk '{print $1}'`if [ -n "$warning" -a -n "$critical" ] then if [ `expr $max_over_time > $warning` -eq 1 -a `expr $max_over_time < $critical` -eq 1 ] then echo "WARNING - $num_trx TRANSACTIONS RUNNING,go over for $max_over_time seconds" exit $ST_WR elif [ `expr $max_over_time > $critical` -eq 1 ] then echo "CRITICAL- $num_trx TRANSACTIONS RUNNNING,go over for $max_over_time seconds" exit $ST_CR else echo "OK- TRANSACTIONS RAN successfully." exit $ST_OK fi fi2,在nagios客戶端添加腳本監控
先測試下腳本[root@wgq_idc_dbm_3_61 binlog]# /usr/local/nagios/libexec/check_trx -w 30 -c 60Warning: Using a password on the command line interface can be insecure.Warning: Using a password on the command line interface can be insecure.OK- TRANSACTIONS RAN successfully.[root@wgq_idc_dbm_3_61 binlog]#
在nrpe.cfg里面添加監控命令[root@wgq_idc_dbm_3_61 binlog]# vim /usr/local/nagios/etc/nrpe.cfgcommand[check_mysql_trx]=/usr/local/nagios/libexec/check_trx -w 30 -c 60
以后重啟nagios客戶端監控, service nrpe restart4,在nagios主監控服務器上面添加配置選項
先去nagios服務器上面check1下[root@localhost etc]# /usr/local/nagios/libexec/check_nrpe -H10.254.3.61 -c check_mysql_trxOK- TRANSACTIONS RAN successfully.[root@localhost etc]# 在services.cfg里面添加事務監控選項:define service{ host_name mysqlserver service_description Check mysql transctions check_command check_nrpe!check_mysql_trx max_check_attempts 5 check_command check_nrpe!check_mysql_trx max_check_attempts 5 normal_check_interval 3 retry_check_interval 2 check_period 24x7 notification_interval 10 notification_period 24x7 notification_options w,u,c,r contact_groups opsweb }在commands.cnf里面添加事務監控命令:# add by tim.man on 20141201define command{ command_name check_mysql_trx command_line $USER1$/check_mysql_trx -w $ARG1$ -c $ARG2$ }郵件短信報警電話報警已添加,所以無需重新配置。然后重新加載nagios[root@localhost objects]# service nagios reloadRunning configuration check...Reloading nagios configuration...done[root@localhost objects]#
5,去nagios主監控界面查看監控效果
正常監控效果:

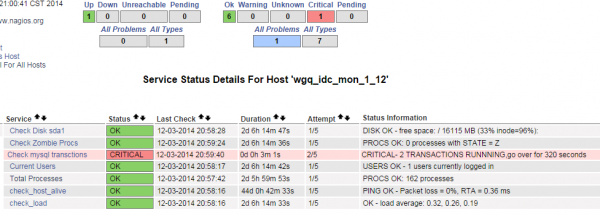
嚴重監控效果:
----------------------------------------------------------------------------------------------------------------
<版權所有,文章允許轉載,但必須以鏈接方式注明源地址,否則追究法律責任!>
原博客地址: http://blog.itpub.net/26230597/viewspace⑴355720/
原作者:黃杉 (mchdba)
----------------------------------------------------------------------------------------------------------------
生活不易,碼農辛苦
如果您覺得本網站對您的學習有所幫助,可以手機掃描二維碼進行捐贈

------分隔線----------------------------
------分隔線----------------------------


